
Debugging your flow
When your flow doesn't work quite as you expected or if you're curious about its behavior, you can inspect its inner workings using debug mode. When debug mode is enabled, FlowBuilder will log all activities from the latest 5 calls, including the route taken and useful messages for each block triggered. This will clarify why a specific path was chosen.
When debug mode is enabled, it's no longer possible to make changes to your flow. If you want to update your flow, you first have to disable debug mode again.
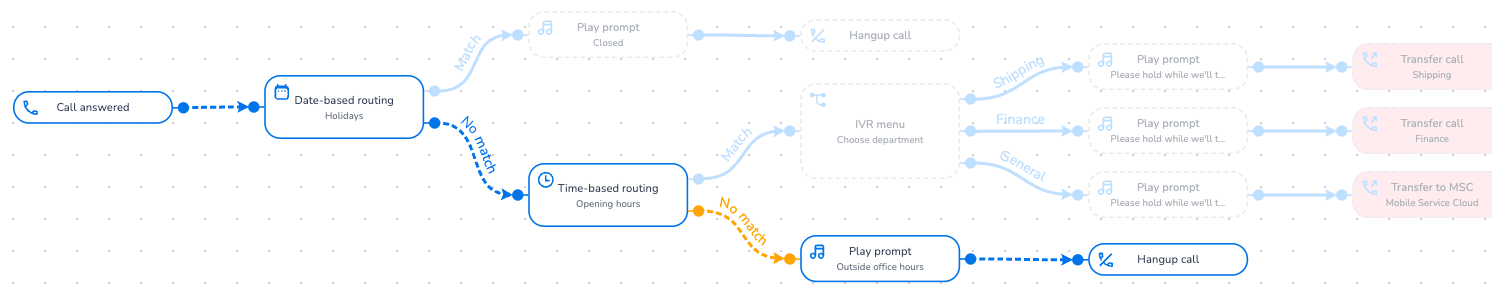
Example of a call made to a flow, visualized in debug mode.
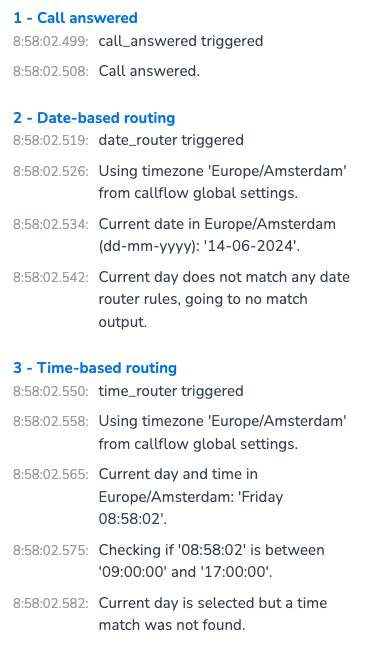
Example of messages logged by the debug mode showing the choices made by the FlowBuilder.
Enabling debug mode
To enable debug mode, please make sure all your latest changes are saved by clicking File > Save. After saving, debug mode can be enabled by pressing File > Enable debug mode:
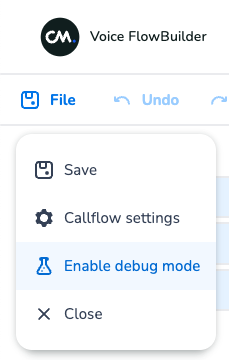
Location of the button to enable debug mode in the call flow editor.
When you press this button, a popup will appear with a short description of what debug mode does. After confirming this popup, your flow will be placed in debug mode.
Important note
Due to the performance impact caused by debug mode, it's recommended to use debug mode only when necessary, as it may lead to slower execution times.
The editor will look slightly different when debug mode is enabled. In the sidebar on the left side of your screen you'll be able to select one of the latest 5 calls made to your flow. Your flow on the right will be greyed out. When a call is selected, the blocks that where used in your flow will light up, as well as the connection lines between these blocks that were used.
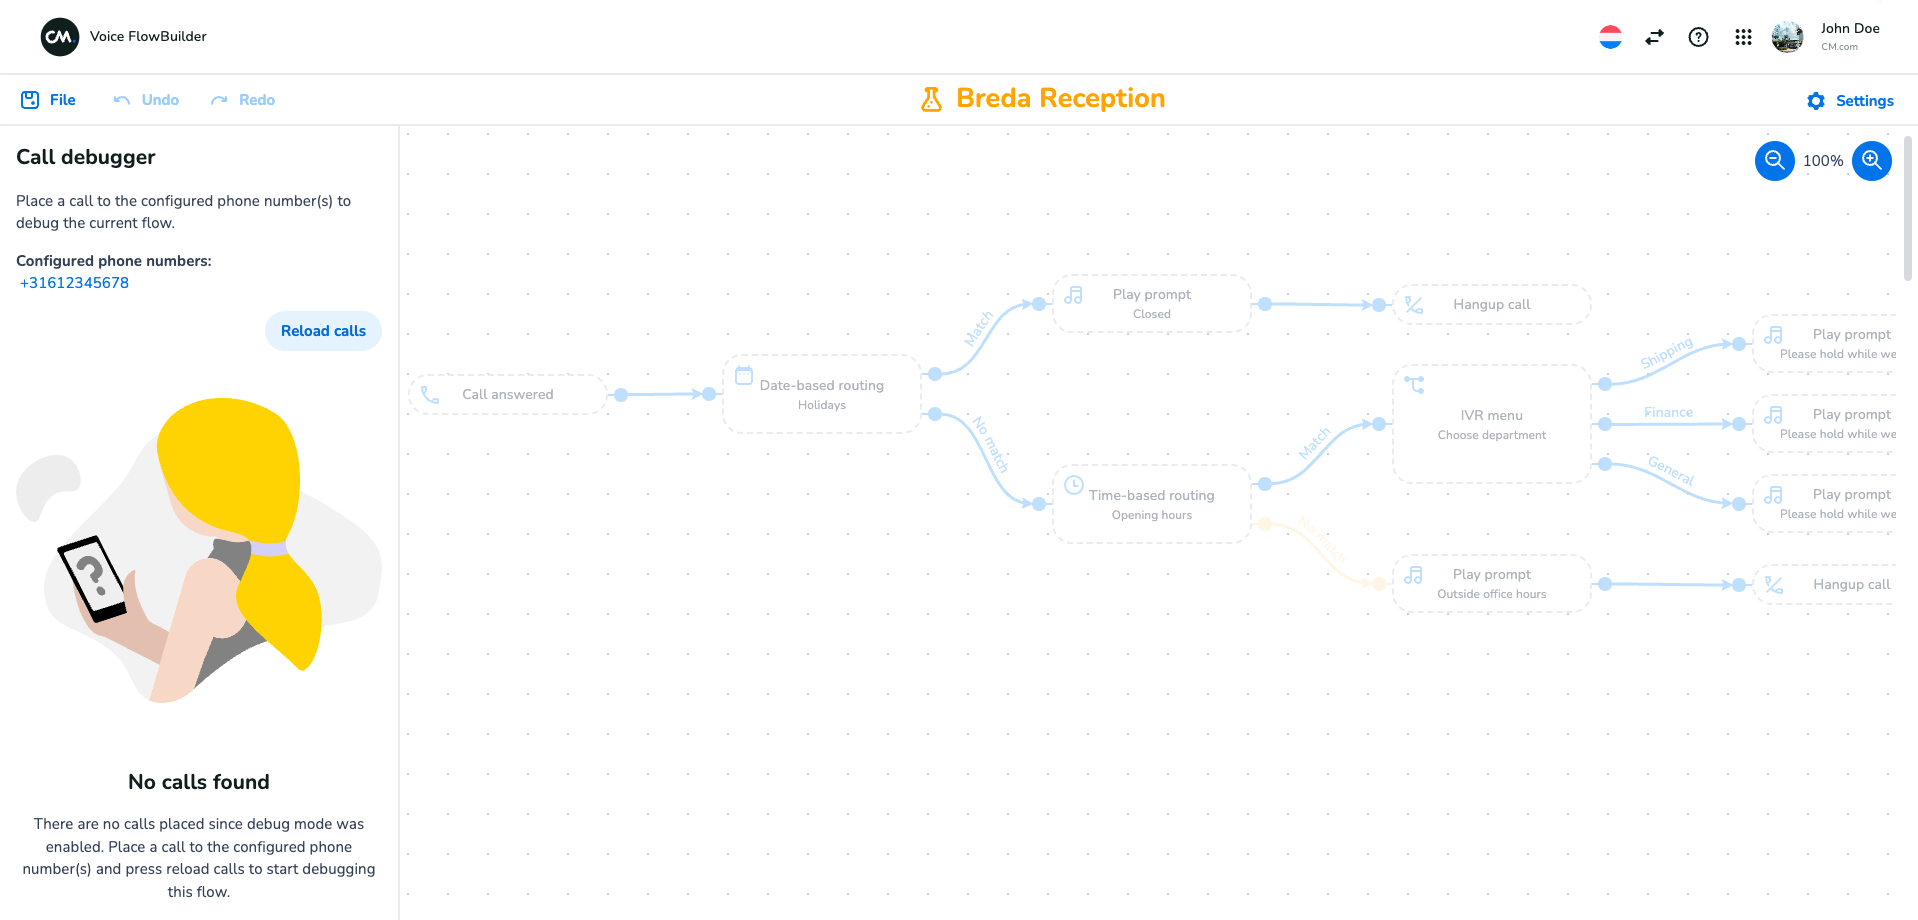
Callflow editor with debug mode enabled.
After you placed a call to your flow, you can press the Reload calls button to fetch the latest debug data. When a call has been found, it will automatically be selected and you can start the debugging process.
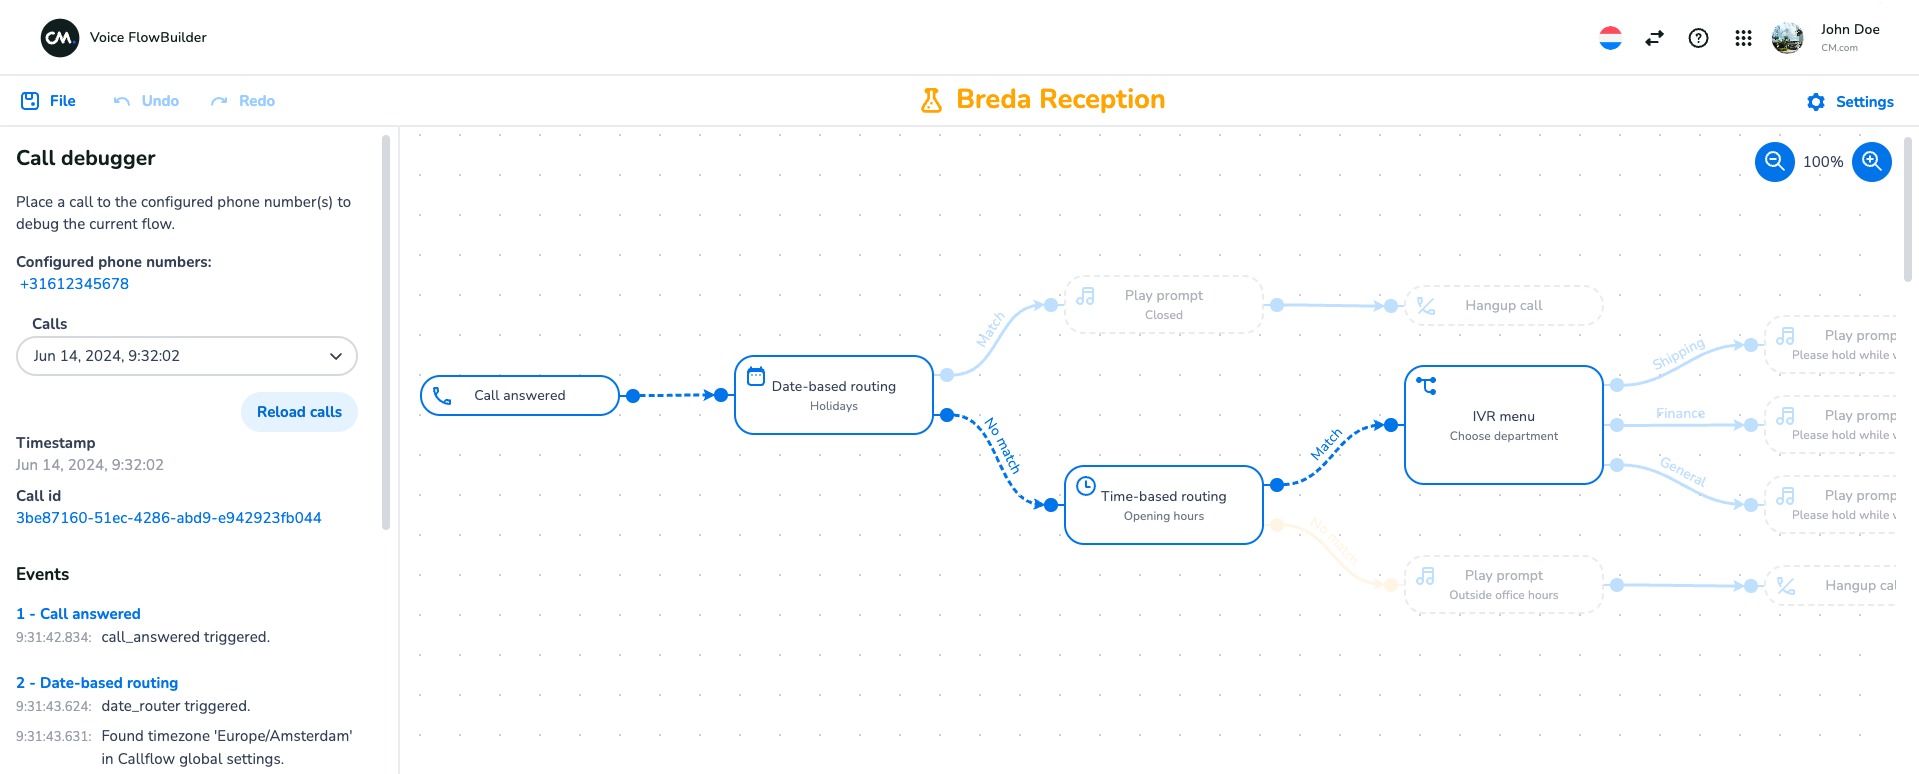
Callflow editor with debug mode enabled and a call selected.
Disabling debug mode
When you're done debugging, or if you want to make changes to your flow, you can disable debug mode again. This is easily done by clicking File > Disable debug mode when the flow editor is opened:
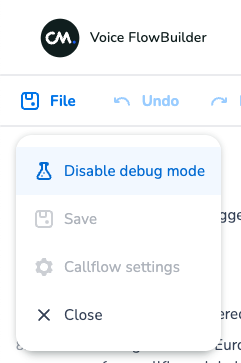
Location of the button to disable debug mode in the call flow editor.
Or by pressing the context menu in the call flows overview page:
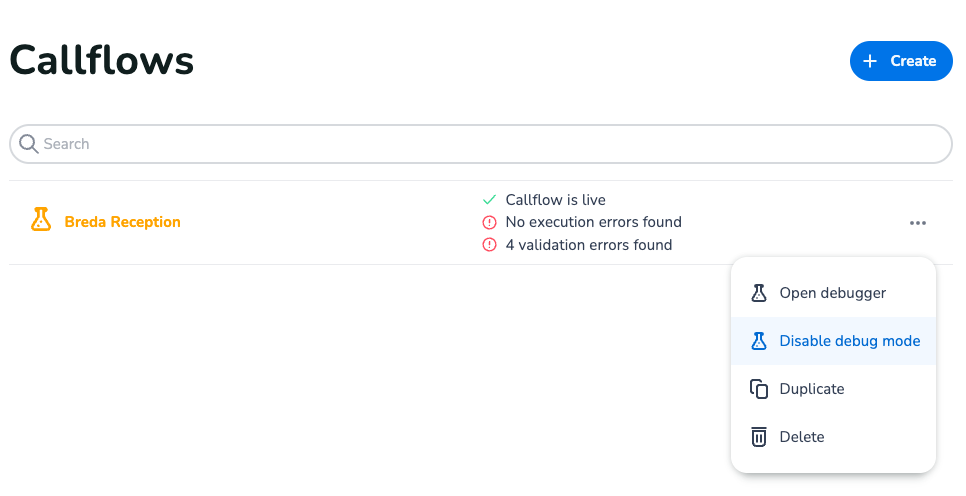
Location of the button to disable debug mode in the call flows overview page.
Updated over 1 year ago